
You want to visualize colorful charts, pictograms and graphics on your site?
Visualizing data always makes it easier for users to comprehend the information you are sharing.
It all depends on the goals you wish to achieve, as there are a number of tools and plugins for WordPress that will help you create the best possible charts and infographics.
What is Data Visualization?
It simply means turning data into graphics such as charts, interactive graphs and tables.
It can be a lot easier to spot certain patterns and trends if you create visual representation of the provided data. It helps you figure out exactly what your data is telling you.
For example, when looking at your stats at Google Analytics, you are most likely looking at the line graph. This will show you an upward trend in traffic over the past 6 months.
Data visualization can be useful when enhancing blog posts, and letting visitors interact freely with your website.
WPForms – Survey and Polls

WPForms is a premium version plugin and provides a great way to run polls and surveys on your blog. You can also see the results in a much better visual way.
In order to run a survey, you would need to sign up for the Pro account and higher using the WPForms website. Once this is done, you can download and install the plugin on your website.
You can create the survey after installing the Survey and Polls addon. This can be done from WPForms – Addons from the WP Dashboard.
A great option of this plugin is that it allows already existing forms to be turned into surveys. It saves tons of time if you already have a form which helps you gather data.
You can also choose between different types of visualization for your data, as there is no limit to just one type of chart or graph.
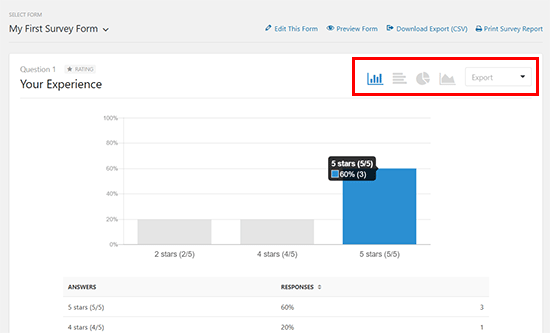
You also have the option to download the charts in different formats, like pdf and jpg. This makes it easier to use your results in different blog posts, as well as at work or university.
Formidable Forms
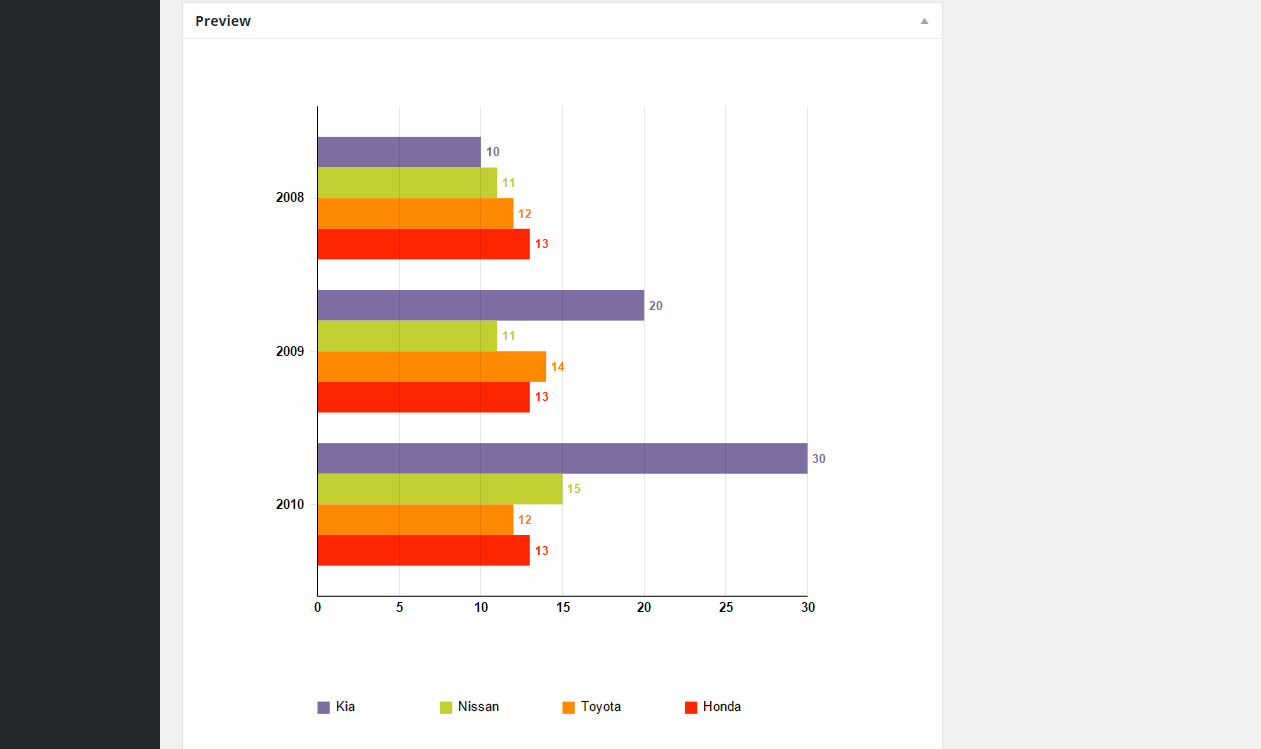
This is a highly advanced WordPress plugin which allows you to create complex forms.
You can use it for creating a different range of forms, such as horizontal bar graphs, column graphs, pie charts, scatter graphs, area graphs, and even geographic heat maps.
The charts can be displayed anywhere on your website with the help of a shortcode. This makes is simple to just put the charts on pages and posts.
Prior to creating the graph, you would need to use the plugin in order to gather the data first. Any type of data can be turned into graph, by just setting the proper type into the shortcode.
By using shortcode parameters you can style your graphs anyway you like. For example, by adding hex codes to the shordcode you can choose the colors. You can also filter data, so that it’s designed for certain users.
Formidable Forms comes with a shortcode builder which helps you choose the code you wish to create.
Visualizer

Visualizer is a charts and table plugin which lets you create interactive data for your website.
In the free version you can find nine types of charts, such as area charts, line charts, column charts, pie charts, etc.
The charts can be added without the need of installing any additional plugins.
If you decide to use the premium version, you will have six additional chart types, as well as email support included. And if you change your mind, there is a 30-day money-back option.
With Visualizer you can create interactive and pricing tables as well.
wpDataTables

It lets you easily create graphs and charts, as well as add data both for mobile and desktop.
You can provide your data by typing it in or uploading a file, while other users can edit them. This changes the charts for them in real time.
Data can be filtered so that it easily shows results from specific locations, dates, etc.
If you decide that the premium version is suitable for your needs, there is also a light version, although it has certain limitations.
Snowball

This is not your average visualization plugin. It’s a specific creation tool, designed for professionals and journalists when writing articles.
A key feature is the ability to make graphs and charts. It’s useful when creating scatterplots and bar charts, as well as maps and data tables.
By using the graphical interface, you can also change the design of your content blocks. If you wish to go further, you can also edit the HTML code and CSS.
Snowball is an entirely free plugin.
Easy Charts
With this free plugin you can create a whole lot of different charts, like area and bar charts, pie charts, plus line charts, donut charts and much more.
Once you submit your data, you can create any chart you wish. It’s very easy to switch between charts and even preview how it would look on the site.
You won’t find any advanced functionality as it’s an entirely free plugin.
Data Table Generator
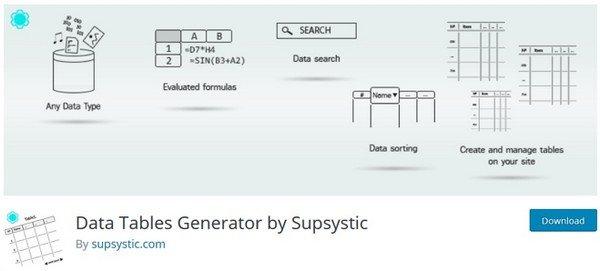
With the Data Tables Generator plugin, you can create responsive tables. For graphs and charts, you will need to use the premium version. You can create all standard charts such as donut and bar charts, pie charts, etc.
The plugin supports PDF, Excel, CSV and Google Sheets, meaning you can use the data from a spreadsheet elsewhere.
A very useful feature is that it can be integrated with WooCommerce, and create product tables that users can check.
We hope our recommendations were useful, drop a comment below if have any experience with some useful chart plugins!