
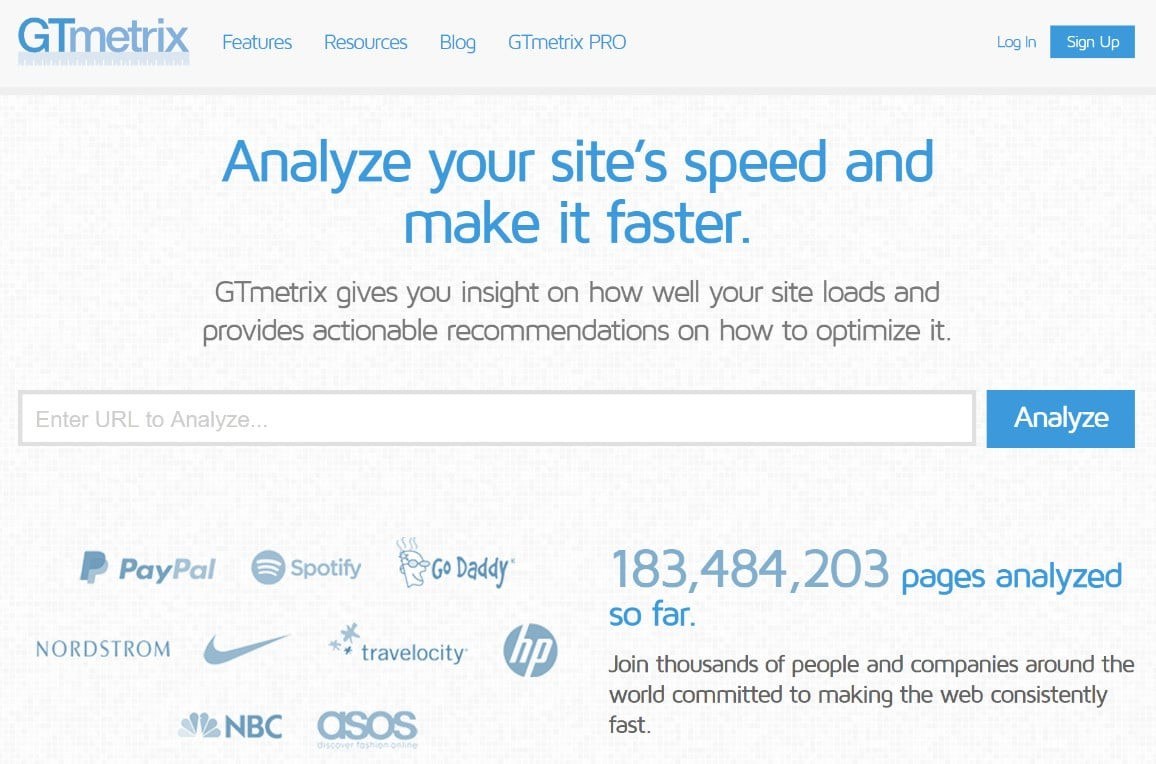
GTMetrix is a very popular performance analysis tool, developed by the hosting company GT.net.
The tool is not only free, but it combines the best of Yahoo’s YSlow scoring matrix and Google’s Page Speed Test. It provides a detailed analysis on what is causing issues with your site’s speed.
The information is presented in a very practical and visual way, which helps you understand the data better. There is also the bonus of GTmetrix interacting fully with WordPress with the help of their plugin, available for download.
You can run a speed test on your website without having to leave the WordPress dashboard.
Sometimes the problem with this type of analysis tools is that their data can be unclear and cryptic. In this post we’ll help you get a clearer picture of how GTmetrix works.
If you want to use GTmetrix from your WordPress Dashboard, make sure to register first for your free account so that you can generate an API key which is required when running this plugin.
Getting Started
In order to correctly set the parameters of your test it’s best to register on GTmetrix . This way you will make the most out of this tool.
Server Location
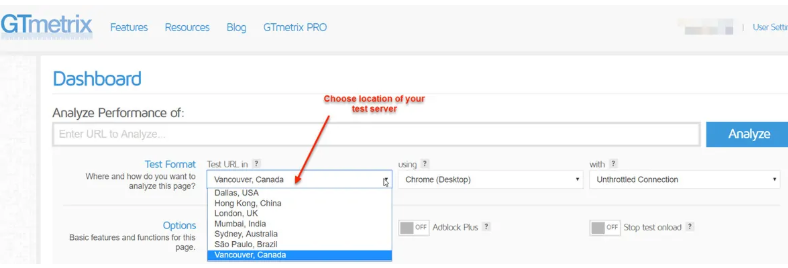
Choose the server closest to the location of your client base. This will provide you with a clear view of user experience depending on local page speed scores.
Browser
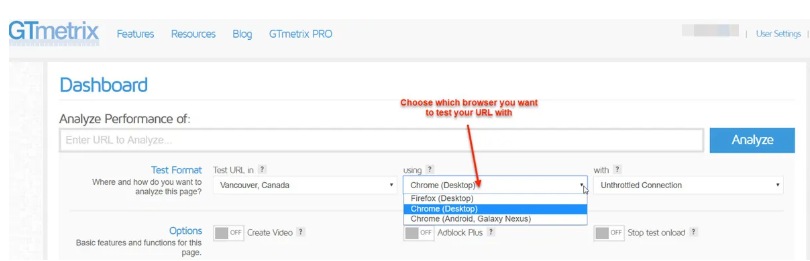
Next you need to choose the desktop or mobile browser you will be using to test the rendering of your URL.
Connection Speed
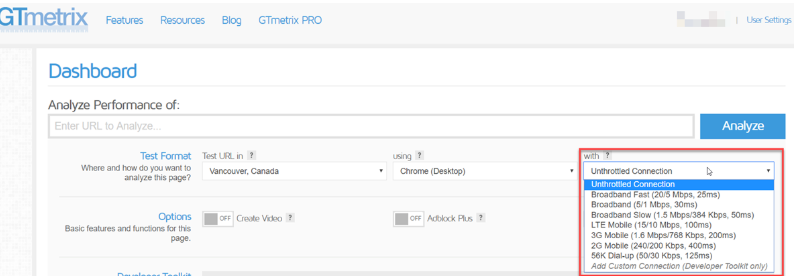
You have the option to choose the connection speed for your test against e.g. 3G vs Fast Broadband. This is vital if you are running a test on how pages load on mobile devises.
Reading a GTmetrix report
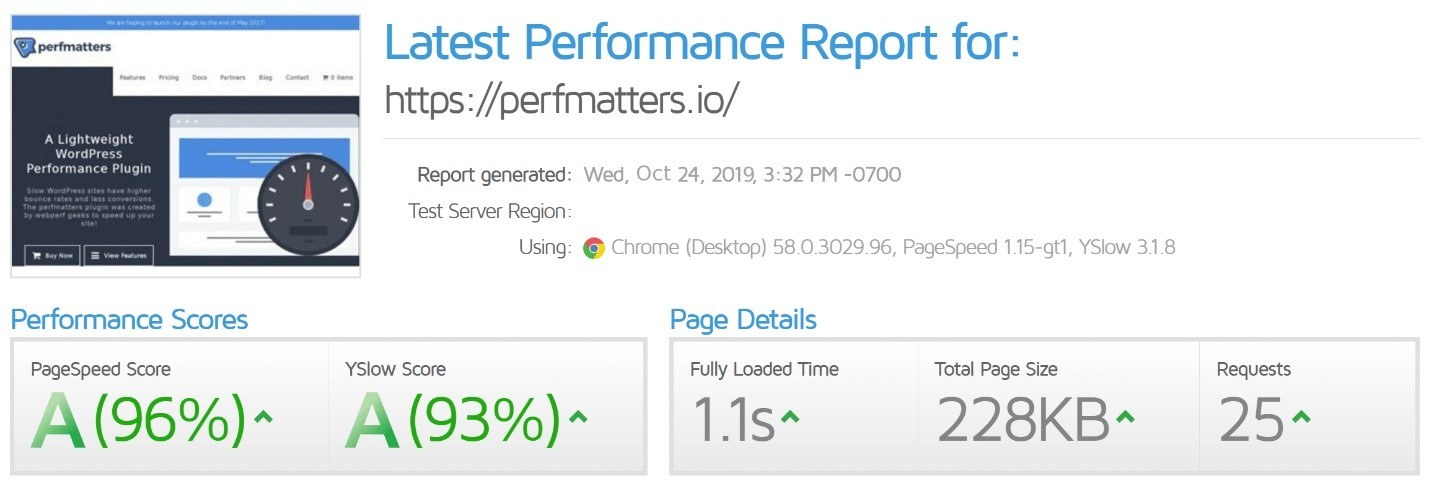
Let’s take a look at the dashboard. Here is an overview of how your website is performing.
- Page Speed – this is the grade your website receives based on Google metrics
- YSlow – this is the grade based on how Yahoo would score it.
The next details you see are Page Details:
- Fully Loaded Time
This is the time it takes for your webpage to become interactive in the browser.
2. Total Page Size
The data downloaded in the test server, such as media assets.
3. Requests
Page Speed
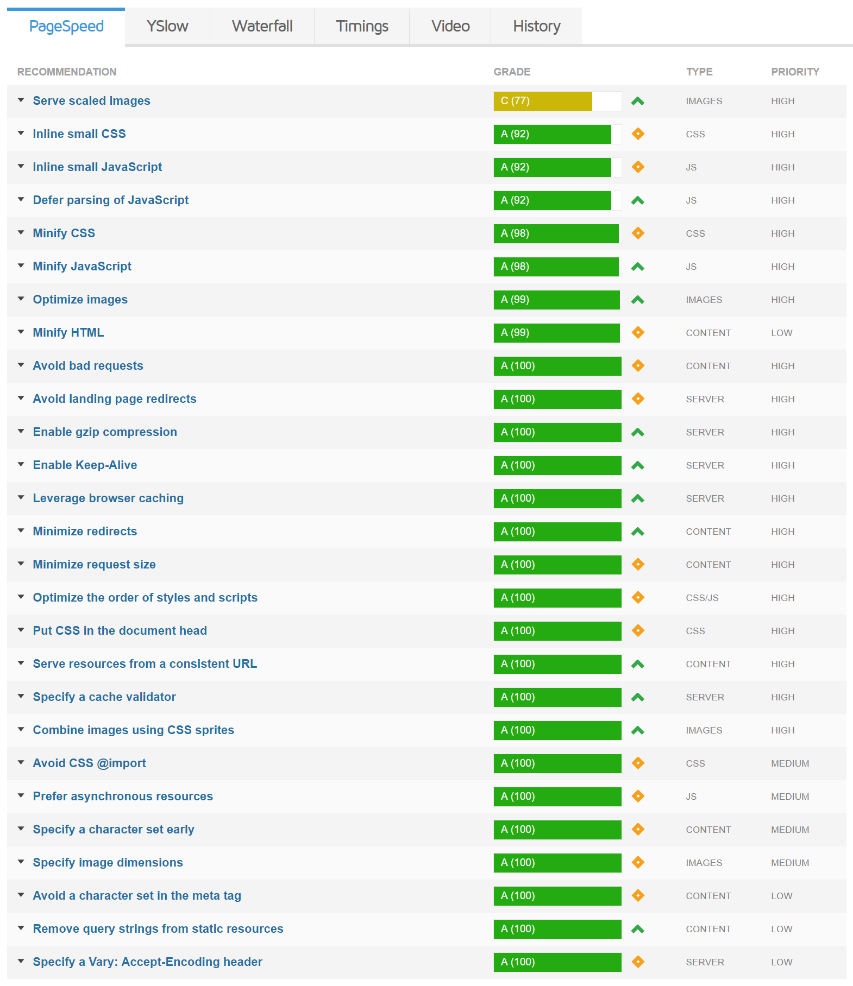
Let’s analyze the issues which have most impact on your page speed.
Optimizing your images
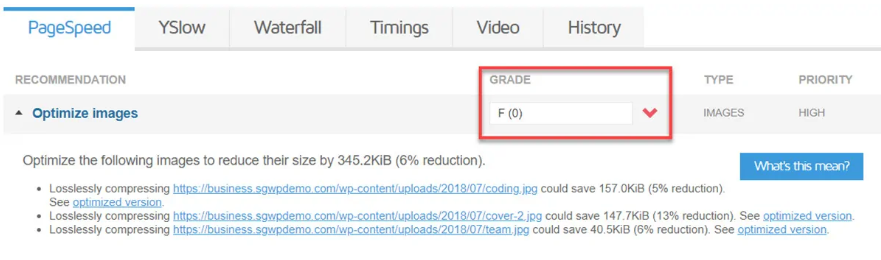
The images you chose can take up around 60% of the weight of your page, which is why you need to optimize them in order to avoid slow loading.
If the image you upload is too small or too large you theme and browser will try to resize it, causing the web page to load more slowly.
To avoid this, use appropriate images.
Minimize Redirects
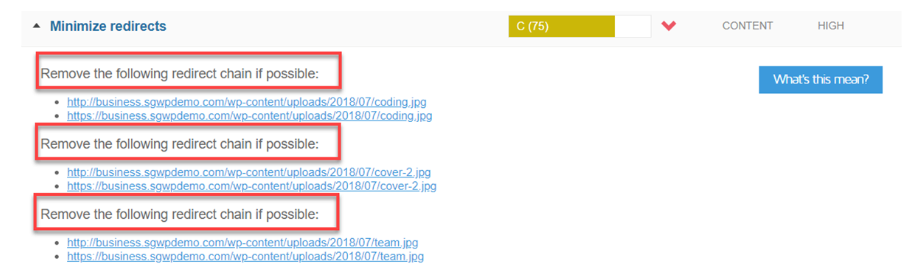
They happen when you make changes in the page URL, redirecting users from the old to the new page. If the site has dozens redirects this can seriously slow down your site speed.
The simple solution is to avoid using redirects if possible.
Minify CSS and JS
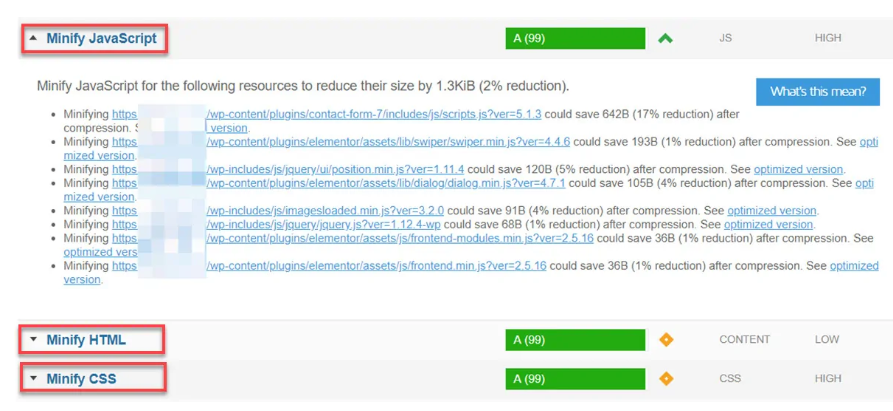
Try to minimize the unused space in your code due to formatting. Even blank spaces have size in bytes, so by reducing file size you can significantly boost your website speed and performance.
Inline CSS and JS
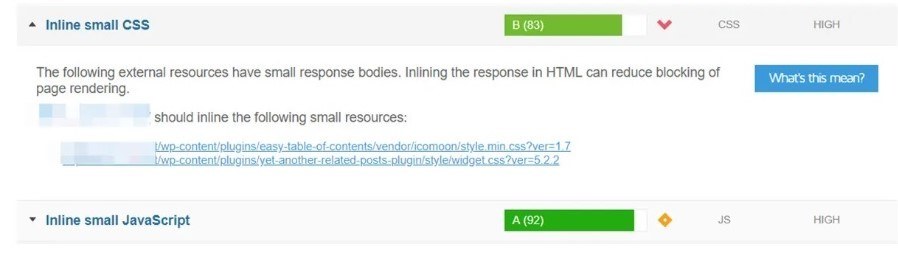
When optimizing site speed, it’s a good idea to combine the scripts from more than one page into one script. If the scripts are made up of a few code lines, then you can simply place them online on the web page.
Have a dev move most of your inline CSS to the CSS stylesheet. If it is still in the green, ignore it, it won’t add much page load time.
Defer Parsing of Javascript
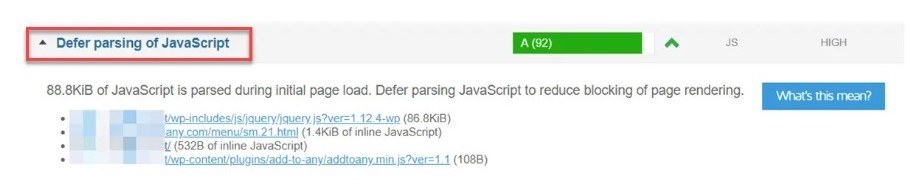
Javascripts are the main reason for slow page load time. The reason is that all script elements need to be the first to load, even if it’s simply your Analytics code.
Another term for this is Render Blocking. It’s caused mainly by the poor coding of a WordPress plugin.
Leverage Browser Caching

This is where the destination browser stores static content for a website locally – images or other assets.
It will save the browser from sending a HTTP request for them to a server.
You can use a free caching plugin to implement browser caching.
Enable Gzip Compression
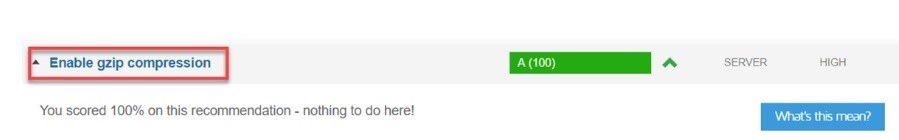
Think of this as WinRAR for your server, smaller files = faster page load time. You can set up the gzip compression personally or ask your web host to do it.
YSlow Recommendations
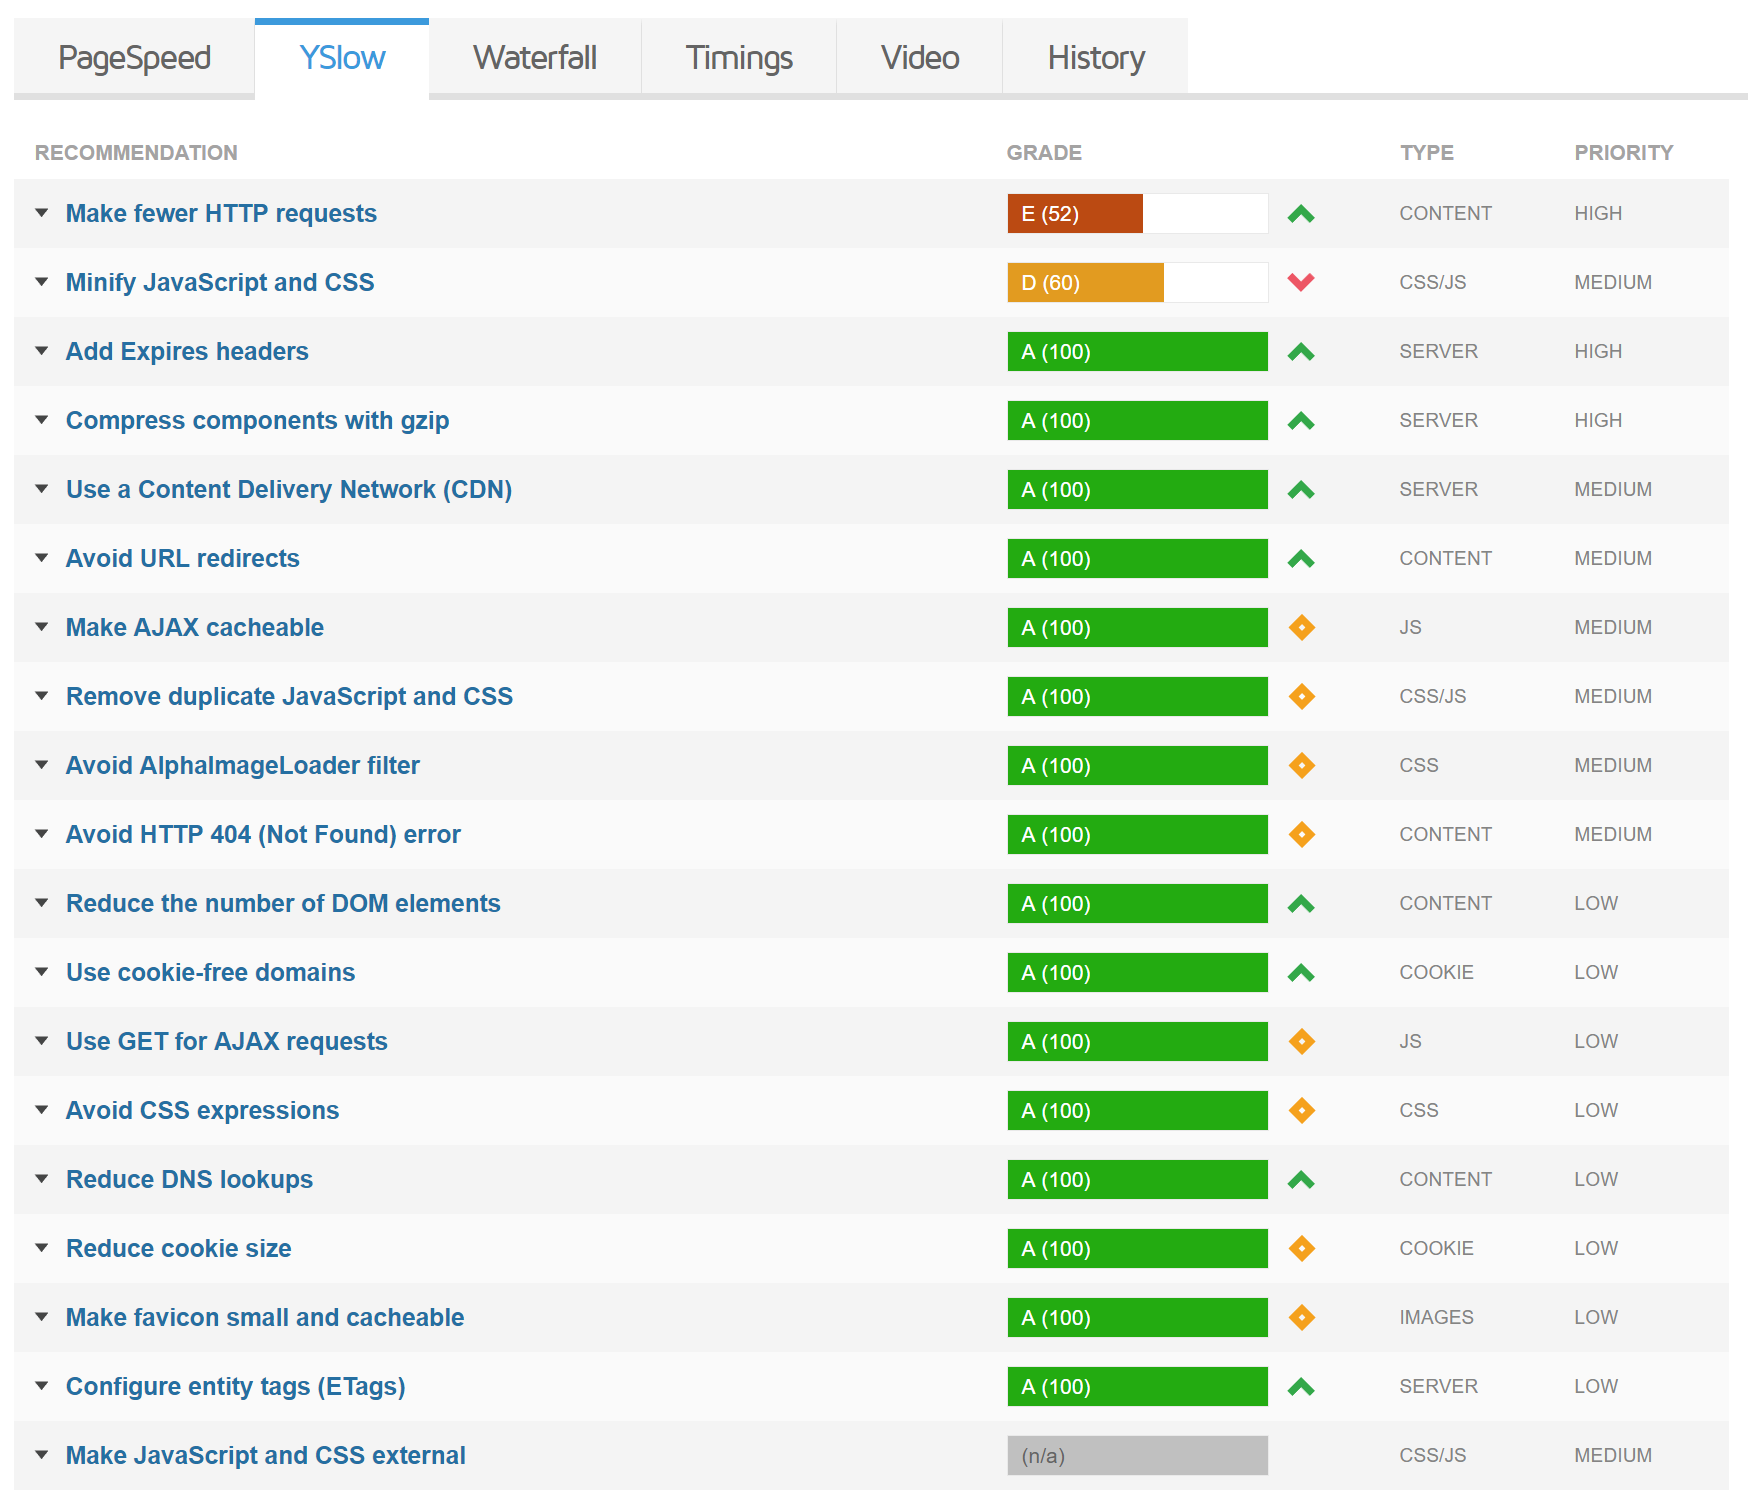
Use a Content Delivery Network
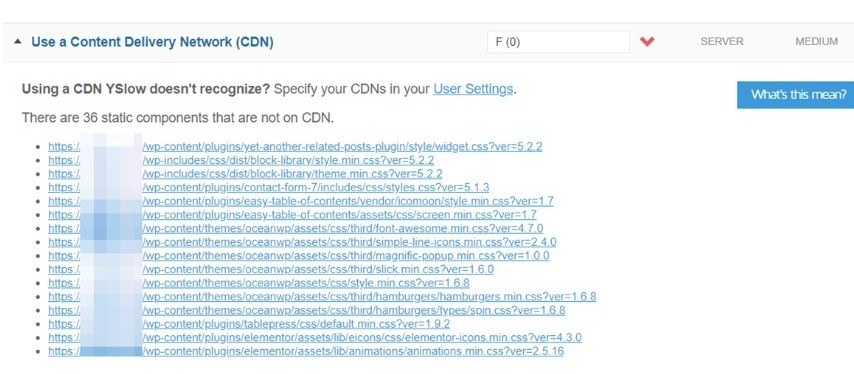
The content delivery network stores a copy of your site on servers around the world. This helps users in different locations not to experience any delay when they view your content.
Add Expires Headers
An expire header is a very small piece of code in your website which tells the server when not to load the cached version of the page and to load a new one.
This is a good option if your web content doesn’t change very often.
Note: when doing this be very careful as it could break your theme.
Use Cookie-Free Domains

Cookies are small text files to a visitor’s computer which customize their experience or gets you credit for an affiliate sale, for example.
The more cookies are delivered from your page, the slower it gets, and this reflects on your YSlow score.
In order to optimize your site, it’s best to use cookie-free domains. If you however need to use cookies for Google Analytics, Facebook ads and other services, don’t cut them for the sake of page speed, it’s not worth it.
If you don’t use the associated services, simply don’t overuse them.
Avoid HTTP 404 (Not Found) Error
All site owners are aware that they need to avoid directing users to broken pages, but sometimes it does happen.
404s are a server-generated response after a specific amount of time has passed in attempting to load the page.
It’s not ideal but you can use a broken link checker or Screaming Frog crawler to track all 404s on your website.
Reduce DNS Lookups
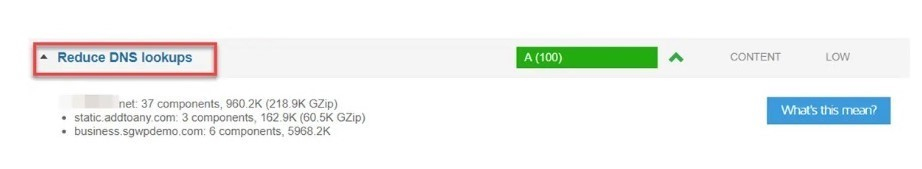
A DNS lookup is when your website must query a DNS server so it can find the current IP address of a site.
If your website is generating dozens of DNS lookups it can cause some problems with your page speed.
If that’s your case, then you need to reduce the number of DNS lookups your website generates.
Waterfall
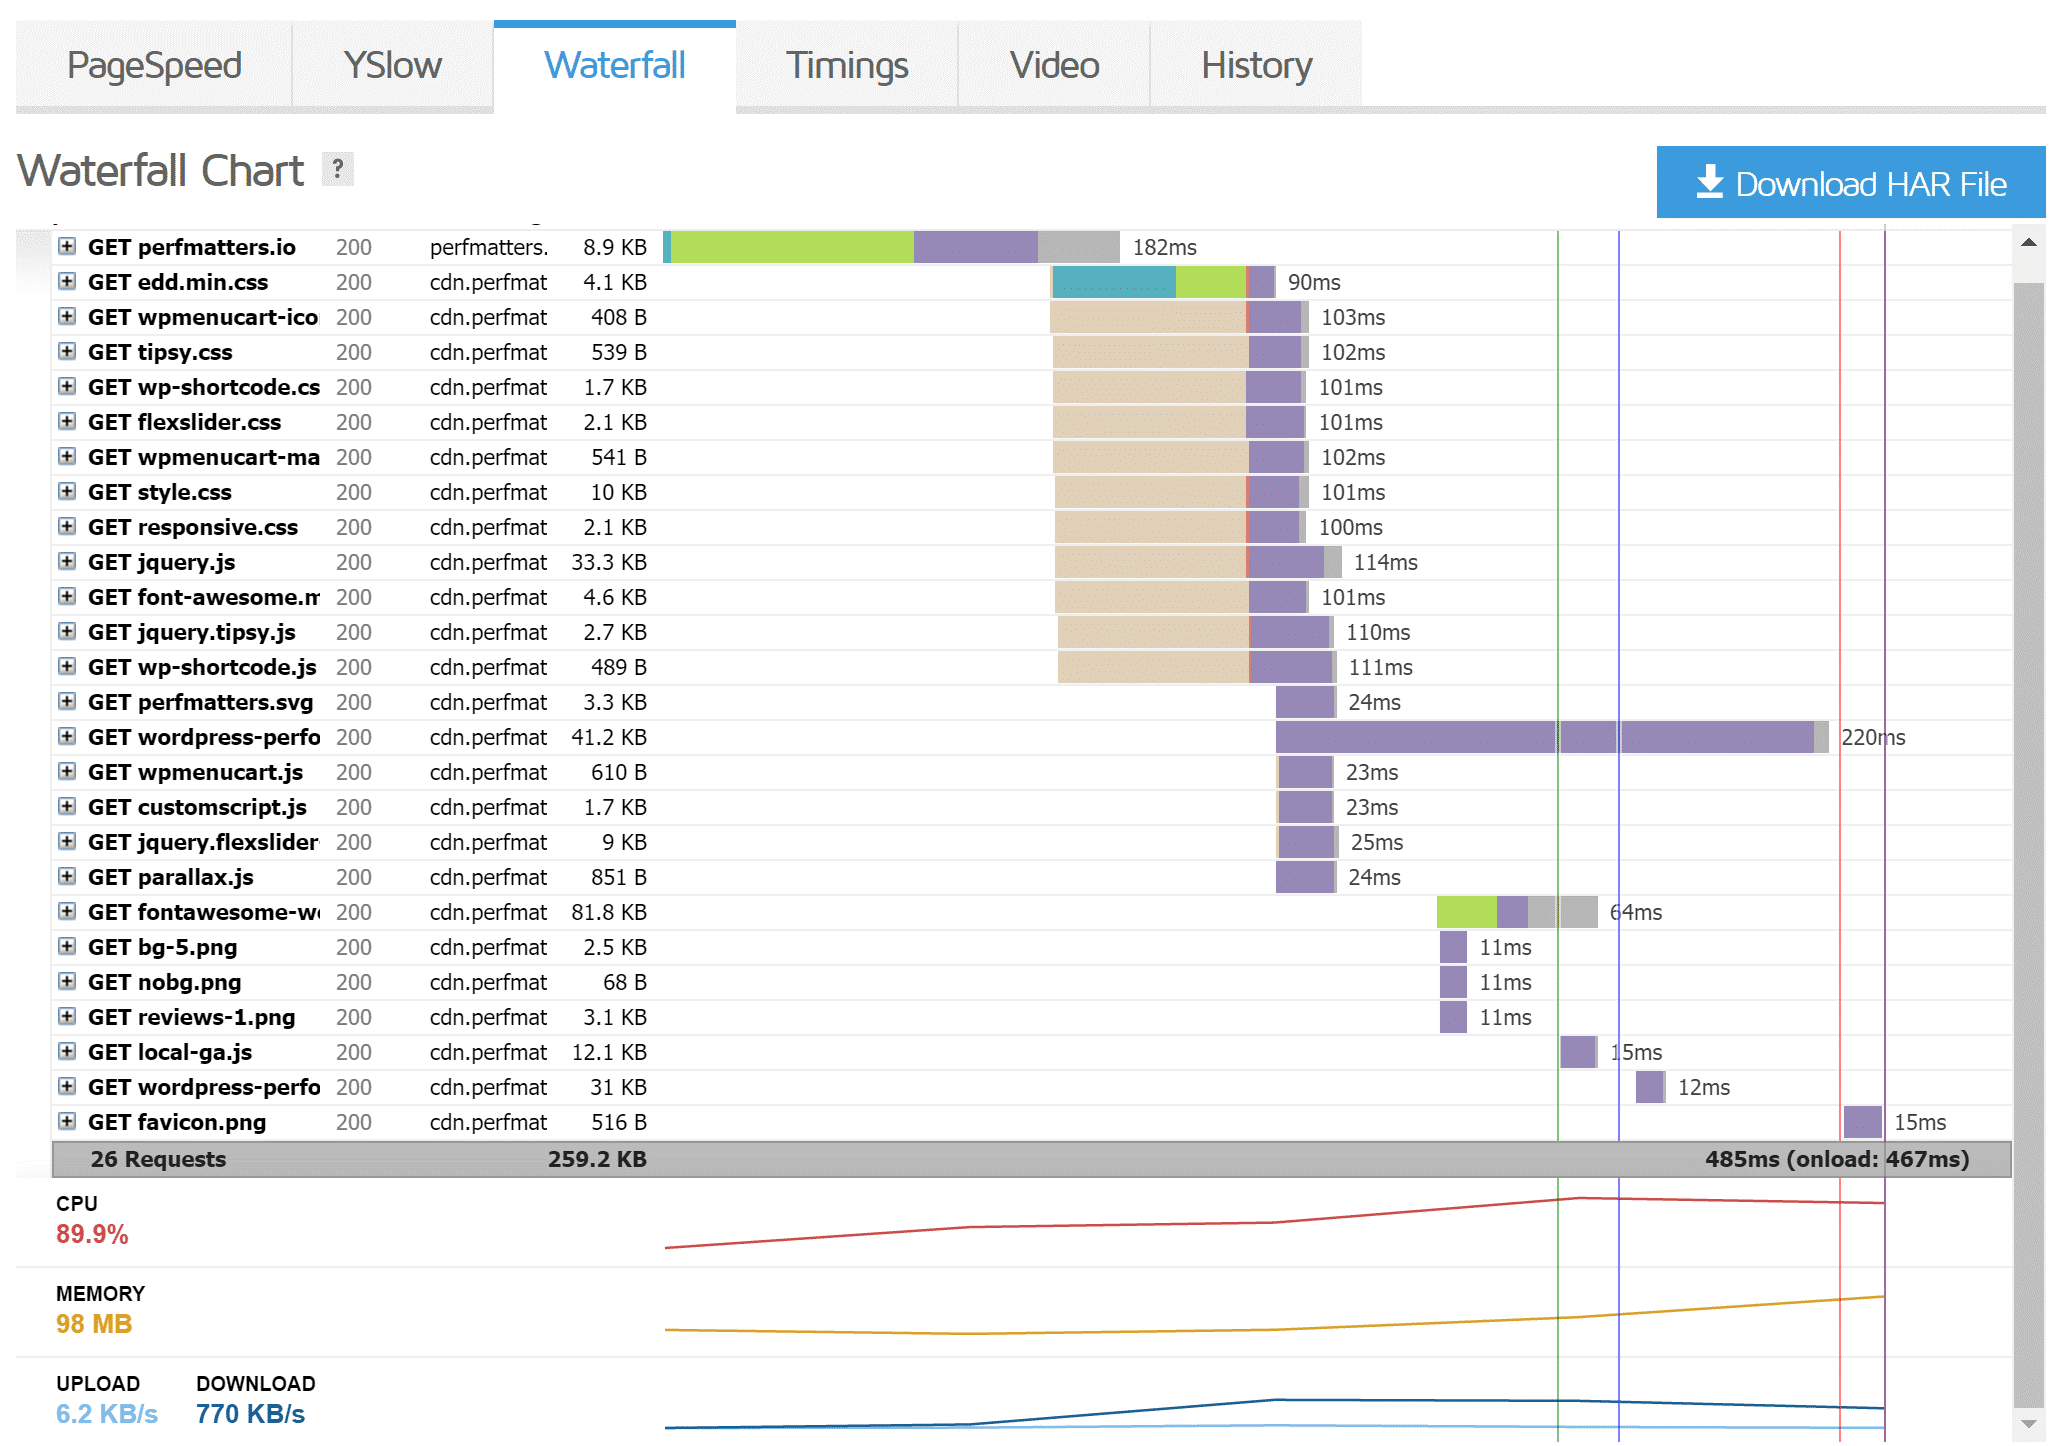
This is a chart made of every request made by your site, which includes JavaScript, media files, CSS, etc. What’s great about it is that is takes the guessing out of what the problem with your site speed could be. You can see a chart of each request and what order was it executed in.
Timings
Because of the terminology used, this chart is very similar to what you will find in the Google PageSpeed result.
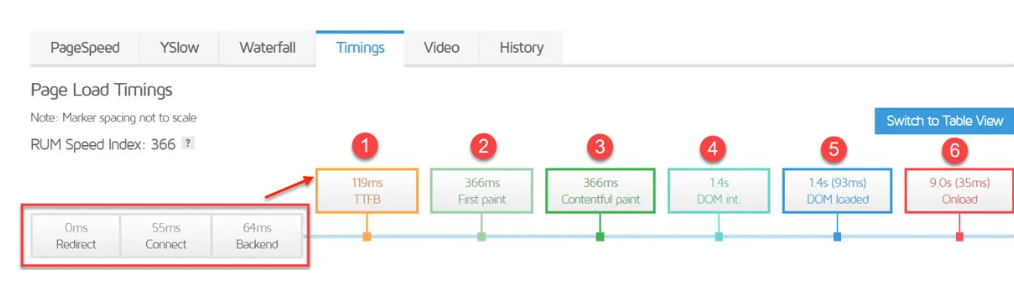
- The server hands are over the first byte of data to the browser after 119 ms.
- “First Paint” takes place after 366 ms – it’s the time it takes to render any page of the page in the browser.
- “First Contentful Paint” – takes place at the same time, meaning the user is already seeing some content of the site.
- After 1.4 s the Document Object Model (DOM) has loaded, which means all scrips will begin to load.
- Site should be fully loaded after 9.0 seconds.
Most important here is the Onload time, which indicates that because of the complex site design there are dozens of HTTP requests generated by multiple JS files.
History
Under this tab you can view all your past speed tests. There is no limit to how many can be stored. There is also the option to monitor a URL so you can keep track of performance and see changes if any occur.
You can also select past reports and make a comparison, which can be very useful if you are doing optimizations to your website and are looking for improvements.
Summary
Understanding how the GTmetrix tool works will help you make a more informed and data-driven decision when it comes to site performance. The waterfall analysis will show you how each individual asset loads.
We hope you’ve enjoyed our articles and can see now just how much data this tool can provide, free of charge, so that you can boost your site’s performance.
Share with us in the comments bellow how the GTmetrix tool helped you improve your site’s performance.